2014-10-13

¿Cómo se formó el Mediterráneo? ¿Cuándo?

[Este post está orientado a estudiantes que comienzan una carrera universitaria en ciencias, no necesariamente geología]

El Mar Mediterráneo es lo que resta en la actualidad del antiguo Océano de Tethys, que quedó atrapado entre las placas tectónicas de África y Eurasia durante su lenta aproximación en los últimos 65 millones de años. A causa de esta aproximación, la corteza terrestre oceánica que alojaba al Océano de Tethys fue obligada a hundirse (a subducir) en el manto terrestre, bajo Eurasia, tras lo cual se produjo la colisión entre ambos continentes, formando los Pirineos, los Alpes y las Montañas de Zagros (orogenia Alpina). Fue así como quedaron desconectados el actual Mar Mediterráneo y el Océano Índico hace unos 15 millones de años.
Sólo en el Mediterráneo Oriental quedan restos de aquella corteza de Tethys que aún no han subducido y que de hecho constituyen la corteza oceánica más antigua preservada en el planeta: unos 270 millones de años de edad. Puedes descargar este espectacular KML para Google Earth y visualizar la edad de formación de la corteza terrestre. 
Fig. 1. Movimiento de las placas tectónicas deducido principalmente a partir del campo magnético grabado en las rocas (técnica conocida como paleomagnetismo) y de la geología y paleontología observadas en superficie. 
Fig. 2. Movimiento de rotación de África respecto a Eurasia en los últimos 190 Millones de años. A partir de medidas de paleomagnetismo en rocas. Vía MantlePlumes.org
Es sorprendente encontrar la corteza oceánica más antigua del planeta en el Mediterráneo, pues el acercamiento entre Europa y África continúa hoy a un ritmo geológicamente rápido, de unos 4 milímetros por año en la región más occidental (entre España y Marruecos), y a velocidades aún mayores y con mayor actividad sísmica en Grecia o Turquía. 
Fig. 3. Movimiento relativo de
Anatolia y el este del Mediterráneo 
respecto a Eurasia, obtenido  
partir de medidas de GPS de alta 
precisión. La longitud de las flechas 
indica la velocidad actual debido a 
la tectónica medida en una estación 
de GPSLas mayores corresponden 
cm/año.
Fig. 4. Modelo de la velocidad tectónica en el Mediterráneo (flechas 
relativas a Eurasia) y de las tasas de deformación que implican


Pero el Mar Mediterráneo ha tenido una evolución tectónica más compleja que la simple subducción de África bajo Eurasia, como reflejan la heterogénea distribución de los terremotos (Fig. 5) y los varios dominios o subplacas cuyos movimientos tectónicos responden de manera poco intuitiva al acercamiento entre los dos continentes (Fig. 6b).

Fig. 5. Distribución de terremotos y su profundidad en el área mediterránea.

Como consecuencia de la geometría heredada de ambos continentes, se han formado varias zonas de subducción diferenciadas (Fig. 6b) en las que la corteza oceánica de Tethys es cabalgada por los márgenes del sur de Europa antes de sumergirse en el manto terrestre. Un ejemplo es la subducción que se produce en el Arco de Calabria (Sicilia y sur de Italia), donde la placa Africana subduce bajo el Mar Tirreno, dando origen a una importante actividad sísmica y volcánica (Etna, Stromboli, etc, Fig. 6c). 
Fig. 6a. Esquema del proceso de subducción
de las placas tectónicas oceánicas.


Fig. 6c. Hundimiento y retroceso del slab
(de la porción de placa tectónica subducida)
de Tethys dando lugar a la formación por
extensión de la  corteza del Mar Mediterráneo
(Mar Tirreno en la imagen). África a la 
derecha; Europa a la Izda. De Faccenna 
et al., GJI, 2001)

Fig. 6b. Mapa tectónico simplificado del Mediterráneo actual
mostrando la edad de formación de la nueva corteza oceánica
 (azul, de hasta 25 millones de años) tras la subducción del 
Tethys en la parte occidental. Las zonas mucho más antiguas 
de corteza oceánica en la zona oriental (morado) 
corresponden a la placa del antiguo océano de Tethys. Las 
líneas dentadas rojas indican las fosas donde esa placa se 
adentra en el manto (subduce) bajo Europa.
Para entender la formación del Mediterráneo es clave comprender un proceso llamado extensión de tras-arco (back-arc extension), que es el estiramiento o extensión de la corteza terrestre que ocurre detrás de una zona de subducción, encima del slab subducido (a la izda. en el corte de la Fig. 6c). Debido a la mayor densidad de la placa de Tethys, ésta se hundió en el manto succionando y estirando la placa bajo la cual subducía (Europa). A consecuencia de esa dinámica (Fig. 7) se separaron del continente europeo las islas de Córcega, Cerdeña y Baleares. Otro ejemplo más lejano del mismo proceso es la separación que actualmente se produce entre Japón y Asia, debida a la subducción de la placa Pacífica bajo la fosa donde se originó el terremoto de Sendai

Fig. 7. Izda.: la extensión de tras-arco es un estiramiento de la corteza que se produce encima de los slabs subducidos. Vídeo: Simulación de la extensión de tras-arco (back-arc extension) debida al hundimiento y la retirada de una placa tectónica (slab retreat or slab rollback), modelo de Moresi y coautoresSi el lado izquierdo fuera África y el derecho Europa (al revés en el esquema de la izda.), entonces la extensión que se produce en el centro correspondería al Mediterráneo. 

Fig. 8. Reconstrucción de la retirada del slab (slab retreat) que da lugar a la extensión del Mar Tirreno y del Golfo de Valencia, separando las islas Baleares de la Península Ibérica, hace unos 25 millones de años. Las líneas discontinuas indican la posición de la subducción hace 30 y 16 millones de años. Las flechas negras indican también el mismo proceso ocurrido en el arco helénico (Grecia) y en la Cuenca Panónica (Hungría/Rumanía).

En resumen: hoy el Mediterráneo occidental ocupa una enorme cuenca extensiva de tras-arco desgarrada tras la subducción de la corteza oceánica de Tethys bajo el continente europeo y la posterior colisión continental entre África y Eurasia. Esta es al menos la visión más generalizada hoy entre los geólogos.

La conexión del Mediterráneo con el océano global fue cancelada también por el lado Atlántico, durante la crisis salina del Messiniense, pero esto supuso sólo un breve episodio de 630,000 años, hace unos 6 millones de años. El restablecimiento de las condiciones normales al final de ese episodio simplemente restituyó la conexión atlántica y la configuración del Mediterráneo que ya era muy parecida a la actual antes de la crisis salina. 

2014-08-18

67P - how much is a comet worth

I've been trying to learn a bit more about comets (call it summer-research) taking the chance of the visit of the ESA Rosetta mission to comet 67P (aka Churyumov–Gerasimenko).

Comets are small bodies of rock and ice thought to form in the outer regions of the solar system at the same time planets were formed, ca. 4.6 billion years ago. An important known unknown about comets is their relative contribution to the accumulation of water in the early Earth. So learning about them is learning about our planet too.

67P is a 4 km-long ice body orbiting around the sun every 6 years, following an elliptical orbit ranging between those of the Earth and Jupiter.
Barcelona and 67P, to scale
The shape of 67P suggests that it might be the result of the accretion of smaller comets. In fact, one thing that surprises many of us who are unfamiliar with comets is their low density. Most of the comet you see in these pictures has been left empty during its formation. 67P is about 10 2.5 times lighter than water: 102 400 kg/m3 (figures updated after Rosetta's approach), implying that it is a very porous body. Is this related to an accretion process?
Image taken on 2014-08-12 from a distance of 103 km. Credit: ESA/Rosetta/NAVCAM

Another curious fact: 67P used to have a perihelion distance of 2.7 AU (1 AU = distance from the Sun to the Earth), but in February 1959 an approach to Jupiter reduced this to only 1.3 AU, where it remains today. Comets are often shifted by the gravity field of planets, but recent events like this remind us that we are not in a static Solar System. The same process can lead to the split of comets in pieces: a beautiful example is given by the comets 42P/Neujmin and 53P/Van Biesbroeck, which appear to be fragments of a parent comet. This is based on computer integration, a reconstruction of their past position, showing that both comets were close to Jupiter in January 1850 and had nearly identical orbits before that. The debris produced by such comet disintegrations is often responsible for meteor showers like the Perseids seen worldwide in middle August.
Approach to a distance of 104 km.
67P rotates once every 12.7 hours.
Credit: 
ESA/Rosetta/NAVCAM

Rosetta's won't be the first mission actually touching down on a comet (check this list of space missions that have approached comets, and see the unsubtle 'landing' of Deep Impact in the animation below). But it is the first mission ever to smoothly land on a comet (Philae lander) and to analyze its surface. And it is the first mission to orbit a comet, something remarkable since the escape velocity of 67P is only 0.5 m/s. It will also be the first mission to land a probe on the surface and, in the words of ESA, Rosetta will be "the first spacecraft to fly alongside a comet as it heads towards the inner Solar System, watching how a frozen comet is transformed by the warmth of the Sun". A lander will sample the composition and structure of the comet nucleus, drilling more than 20 cm into the subsurface for analysis at the onboard laboratory. 

Rosetta has costed the europeans around 1 billion euros (10^9 €) through a consortium of the German Aerospace Research Institute (DLR) with ESA, CNES, and european and american research institutes. The results will provide information on how comets form and also on the early stages of the Solar System. It should contribute to the discussion on where did the terrestrial water form and when did it arrive here. Previous studies have shown that the isotope ratios of hydrogen in other comets is different from that of oceanic water, but it remains unclear that these comets were representative enough of the comet orbits most likely to contribute to our waters. New answers will arrive soon, together with new questions. 

Deep Impact colliding with comet Temple 1 in 2005

2014-06-05

Dynamic topography vs. isostasy: The importance of definitions

Fig. 1. Airy isostatic model: every column of rock above the
compensation level should have the same weight.
High topography is compensated by a mass deficit at
the base of the crust (crustal root) 
The term 'Dynamic Topography' is one of the top trending topics in Solid Earth science. It has now prevailed for more than 2 decades, but still the concept involves significant confusion. Dynamic Topography refers to a part of the elevation of the Earth surface that cannot be accounted by the classical crustal isostatic models (Pratt or Airy). But is the term referring to all mantle-sourced loads? Or only to those forces created by the dynamic flow of the mantle? Let's see first where the current confusion exactly comes from.

The term was actually coined by oceanographers to refer to the deviations of the surface of the ocean relative to the Geoid (eg., Bruce, 1968; Wyrtki, 1975). In principle, the geoid should perfectly fit the surface of the ocean, since it is an equipotential surface of the gravity field, but the flow of water adds a secondary shift of the surface, normally less than a meter. This deviation from the surface predicted for a 'static' ocean (ie., the geoid) can be detected in satellite altimetry data because the signal noise introduced by tides, waves, and wind can be removed by time-filtering. The remaining deviation from the geoid is referred to by oceanographers as 'dynamic topography' and is known to be related to the water currents in the ocean.
Fig. 2. Mean ocean dynamic topography from http://grace.jpl.nasa.gov, updated from Tapley et al., 2003).
 It measures the long-term-averaged strength of ocean currents, the 'steady-state'
circulation. 
In the 80s the term was adopted by solid-earth scientists (Hager et al., 1985, Nature). The authors did not follow the original oceanographic meaning, but instead they included 'static' forces originated within the lithosphere (such as the weight of sinking plates, or slab pull) as well as forces caused by flow in the mantle.

Mantle convection model: Mantle temperature (color shading) and flow (arrows). Lines indicate the calculated dynamic topography (blue line) and the horizontal component of plate motion (red, positive means eastward). From Liu et al., 2008, Science
This made sense at the time because there was a big questionmark (still poorly answered today) about the origin of hidden loads, the enigmatic forces needed to explain the depth of sediment accumulations next to mountain belts (see Allen's book Foreland basins, or this article pdf). Sedimentary basins next to orogens in compressional plate boundaries are formed by the isostatic sinking (subsidence) of the lithosphere due to the weight of the growing orogen. These settings became very attractive in solid-earth science not only for prospection purposes, but also because they provide an opportunity to understand how tectonic processes interact with the erosion and transport of sediment in the surface, since the sedimentary layers in such foreland basins record the tectonic evolution of the mountain belt. After many of these foreland basins were modeled, it became clear that the isostatic load of the orogen was generally insufficient to explain the amount of subsidence of the basin. But linking all the hidden load to dynamic effects is misleading, because of the presence of static forces such as the weight of a sinking plate attached to the surface (a lithospheric slab), well known since plate tectonics became mainstream. Another key to understanding the confusion is that before the widespread development of seismic tomography, everything occurring below crustal levels was far more conjectural than today. As a result, part of the Solid-Earth community used the term dynamic topography to refer to all deep-seated forces (originated below the crust) that had an effect on topography, including for instance changes in the thickness of the lithospheric mantle, or a lithospheric slab.

Fig. 3. Two static forces in balance
(weight of the books and the
counteracting human force)
Dynamic forces are added to the
static force to recover the balance
and avoid the books  from falling.
In physics, static vs. dynamic forces refer to whether the forces are in equilibrium (perfectly compensated) or not, and dynamic physical problems refer to motions involving acceleration. This is an additional source of confusion, since both the ocean flow and the Earth's mantle flow can be under steady-state flow and still inflict a constant deflection of the topographic surface, that we yet call 'dynamic'.

But sticking to the original oceanographic definition (as for example in Braun 2010), the dynamic topography of the solid-earth should restrict to the change in elevation produced by dynamic forces related to mantle viscous flow (and flow can only occur beneath the boundary layer of the mantle, underneath the lithosphere). This definition seems robust because the lithosphere is defined based on its strength relative to the underlying asthenosphere, and hence flow-related stresses are expected to be negligible above the lithosphere-asthenosphere boundary (LAB). The fact that the flow is generated by density contrasts does not mean that the forces can be mistaken for static ones, because those density anomalies are out of the rigid body being deformed (the lithosphere).

We therefore can split the observed topography OT into:
OT = CIT + LMIT + MFDT
where CIT is the crustal isostatic topography; LMIT is the Lithospheric-mantle isostatic topography (including slabs attached to the Earth's crust, or the thinning of the lithosphere); and MFDT is the sublithospheric mantle-flow dynamic topography. Note that OT-CIT (easy to calculate using global databases of crustal thickness) is often called residual topography (RT).

Following this notation, the confusion can be described as emanating from some authors referring to LMIT+MFDT (which equals RT) as the dynamic topography, instead of MFDT alone. While this RT ranges in the order of +-1 km, there seems to be no consensus yet as to how large can MFDT be, with values ranging between that same value and a few hundred meters.

Fig. 4. Global free-air gravity anomaly from GRACE. The low values (+-40 mGal) in comparison with the +- 300 mGal that are often attained in smaller regional scales shows that the crust is in overall isostatic equilibrium: the mass excess of topography at high-elevation areas is compensated by a mass deficit at the base of the crust. For this reason there is little correlation between anomaly and continents. The Hawaiian, Yellowstone, Iceland hotspots are represented by highs. Subduction zones show an asymmetrical pair of low & high anomaly. The Hudson Bay undergoes a glacial rebound in response to the deglaciation (+ info here).

Support for the smaller MFDT values comes from reasonings like this: Consider a Stokes sphere sinking or rising in a viscous fluid by virtue of its density contrast with the surrounding fluid (the viscous mantle for us). The vertical velocity of this sphere can be analytically solved and the expression obtained for the dynamic topography it produces depends on its radius a, its density contrast relative to the fluid, the depth of the sphere, and the distance R from the measuring point in the surface to the center of the sphere.
MFDT = ∆h[m] = 2*∆density * a^3 * D * (3D^2+3a^2-5*D^2*a^2/R^2) / (3*fluid_density*R^5) 
Stokes' sphere sinking in a viscous fluid. The gravity anomaly and dynamic topography it generates are linearly proportional to each other.
Because the free-air gravity anomaly produced by the same sphere (∆g) follows a similar equation, the relation between gravity and MFDT conveniently depends only on the of fluid density, to a first approach:
∆g[mGal] = 2πG * density[kg m-3] * MFDT[m]

This means that the +-40 mGal anomalies shown in the global map above should correspond to a dynamic topography smaller that 300-400 m (see P. Molnar's talk linked below).

Clearly, if we knew well the two isostatic contributions CIT+LMIT, then we would be able to attribute the rest to the flow in the mantle and learn about what happens at those depths. As Jean Braun puts it: "Mantle dynamics remain poorly constrained, but by linking mantle flow to surface topography (...) we can use the geological record to constrain the dynamics and viscosity of the mantle and the density structure that controls its flow".
The problem is that there are too many unknowns in the equation: computer models of 3D mantle flow that estimate dynamic topography rely on seismic tomographic imaging of the mantle that provide the distribution of seismic velocity anomaly but how to translate this wave velocity into lateral inhomogeneities in density and viscosity is poorly known. So, fitting the computer models to the weak available observations of dynamic topography and plate tectonic reconstructions will provide only hints on a vague combination of the velocity-viscosity and the velocity-density relationships. So, this will remain as an Earthling Challenge (a Reto Terrícola) for quite some time.

For more information, I recommend Peter Molnar's talk on youtube, Philip Allen's blog post, or Braun's paper listed below. PS: Check also this recent talk by Jean Braun on the interaction between erosion and dynamic topography.


References
  • Allen, 2010, Surface impact of mantle processes, Nature Geoscience.
  • Braun, Jean. "The many surface expressions of mantle dynamics." Nature Geoscience 3.12 (2010): 825-833.
  • Bruce, J. G. "Comparison of near surface dynamic topography during the two monsoons in the western Indian Ocean." Deep Sea Research and Oceanographic Abstracts. Vol. 15. No. 6. Elsevier, 1968.
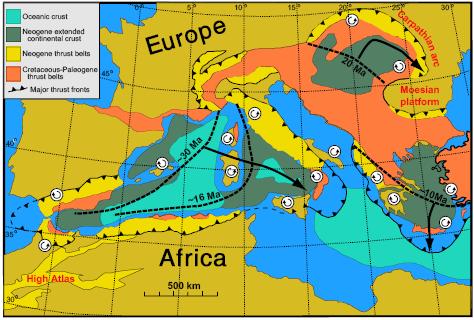
  • Faccenna, C., Becker, T. W., Auer, L., Billi, A., Boschi, L., Brun, J.-P., Capitanio, F. A., Funiciello, F., Horvath, F., Jolivet, L., Piromallo, C., Royden, L., Rossetti, F., and Serpelloni, E.: Mantle dynamics in the Mediterranean. In press at Rev. Geophys., 2014. PDF
  • Hager, Bradford H., et al. "Lower mantle heterogeneity, dynamic topography and the geoid." Nature 313.6003 (1985): 541-545.
  • Tapley B.D., D.P. Chambers, S. Bettadpur and J.C. Ries, 2003: Large scale ocean circulation from the GRACE GGM01 Geoid. Geophys. Res. Letters 30 (22):doi:10.1029/2003GL018622
  • Wyrtki, Klaus. "Fluctuations of the dynamic topography in the Pacific Ocean."Journal of Physical Oceanography 5.3 (1975): 450-459.

2014-03-26

49 Open Challenges in Earth Science - The Known Unknowns

Mapping Ignorance
ResearchBlogging.org
What keeps Earth scientists busy? These 49 open scientific questions aim at providing an updated, fully-referenced account of the main current scientific questions, disputes, and challenges in Geoscience.


[updated version in this link]


The Early Earth and the Solar System

Advances such as those occurred in the geochemistry of meteorites lead to new exciting hypotheses about the early stages of our planet, but as usual, answers are outnumbered by the new knowledge gaps: 
  1. How did the Earth and other planets form? Were planets formed in situ? Or are orbital changes relatively frequent? What determined the different deep layering of the solar planets? [McKinnon, 2012, Science on Mercury] 
  2. Was there ever a collision of the Earth with another planet Theia, giving birth to our satellite? [Canup, 2013, Science] There is compelling evidence, such as measures of a shorter duration of the Earth's rotation and lunar month in the past, pointing to a Moon much closer to Earth during the early stages of the Solar System. [Williams, CSPG Spec. Pubs., 1991]
  3. What is the long-term heat balance of Earth? How did its internal temperature decay since it formed by accretion of chondrites? How abundant are radiogenic elements in the interior? Did a "faint young sun" ever warm a "snowball Earth"? [WiredMarty et al., 2013, Science]
  4. What made plate tectonics a dominant process only on Earth? [outreach paper] How did the planet cool down before plate tectonics?[Moore & Webb, 2013, Nature] Was the Earth's crust formed during the early stages of its evolution or is it the result of a gradual distillation of the mantle that continues today along with crustal recycling? Is the crust still growing or does its recycling compensate for crust formation at mid-ocean ridges and other volcanic areas?
  5. How inherent to planetary evolution is the development of life conditions? [Zimmer, 2005, ScienceElkins-Tanton, 2013, Nature] Earth-like planets are now known to be abundant in our galaxy (two out of three stars may have one [e.g., Cassan et al., 2012, Nature]), but how many of them develop widespread durable water chemistry? How much of our water supplied by comets or asteroids? When and how did it reach the Earth? [outreach article]

Earth’s Interior

Our rock-sampling reach is limited to the upper 12 km of the Earth's crust, but the keys to extend our knowledge often lay far deeper than that. Indirect measurements such as seismic wave tomography, together with geodynamic and petrological modeling, become crucial: 
  1. What are the chemical composition and mechanical properties of rocks in the Earth’s mantle at the extreme pressure and temperature they undergo? As planets age and cool off, their internal and surface processes coevolve, chemically and mechanically, shaping also the atmospheric composition. Therefore this question has direct implications for our understanding of the environmental evolution of the Earth. [Kerr, 2005, Science]
  2. What are the dynamic processes in the Earth interior that accommodate and fuel plate tectonics? As seismometers spread more evenly over the planet's surface, the seismic imaging of the interior will rapidly improve, providing a detailed distribution of seismic wave velocity. Simultaneously, lab-based mineral physics must better constrain what these mechanical wave velocities tell us about the hot, deep rocks of uncertain composition in the mantle. Only then will computer models be able to test the proposed geodynamic models by trying to fit quantitatively those data and other geophysical observations such as gravity variations. [ref.3]
  3. Sedimentary and volcanic rocks have recorded changes of the magnetic field throughout the evolution of the Earth. What causes the sudden reversals of the paleomagnetic field? How does the geomagnetic field link to the iron convection properties at the deep Earth? Or inversely, what can we learn about the mechanical behavior of the materials at those depths from the geomagnetic field? [more context in Nature] Are the magnetic reversals too fast to be related to core dynamics? [example.1] [ex.2] [ex.3] Could their frequency be related to the distribution of tectonic plates? [GRL article]. What causes superchrons (periods longer than 10 Myr without magnetic reversals)? Something internal to the core, or induced externally by the mantle/subducting slabs? Was the geomagnetic field always dipolar, or was it more asymmetric in the past? [introduction]
  4. Are intraplate hotspots really made by deep sources of uprising materials (mantle plumes) coming from the deepest Earth's mantle? Or can they be explained by shallower convection? [e.g., Morgan, 1971; see also this recent Geology paper on Yellowstone].
  5. What is the history of and what controls the excursions of the rotation pole relative to the surface geography, known as true polar wander? [ex]
  6. What are the properties of deep rocks? How can we translate the heterogeneity in density, seismic wave velocity, or electromagnetic resistivity presently observed in the mantle and the lithosphere into variations of the mineralogical composition? And how do these measures relate to the dynamics of the Earth and to key mechanical properties such as the viscosity? [Faccenna & Becker, 210, Nature]. 
  7. What are the causes for Large Igneous Provinces and massive flood basalts such as the Columbia River Basalts?

Tectonic-plate motion and deformation 

The successful adoption of the plate tectonics paradigm has lead to a myriad of new questions about its limits and about the lessons for risk mitigation.
Velocity of the earth's surface at the Indian-Asian collision,
from GPS data. Blue star indicates the 2008 China earthquake.
Source: CALTECH
  1. What is the relative importance of the forces driving plate tectonics: slab pull, slab suction, mantle drag, and ridge push? [e.g., Conrad & Lithgow-Bertelloni, 2004; Negredo et al., GRL, 2004, vs. van Benthem & Govers, JGR, 2010]. What is the force balance and the geochemical cycle in subduction zones? [Emry et al., 2014, JGR] How much water (and how deep) penetrates into the mantle? [Ranero et al., 2003, Nature] How much subcontinental erosion takes place under subduction areas? [Ranero et al., 2000, Nature]
  2. What happens after the collision of two continents? Does continental collision diminish the rate of plate subduction, as suggested by the slab-pull paradigm? [Alvarez, EPSL, 2010How frequent are the processes of mantle delamination and slab break-off? What determines their occurrence? [Magni et al., GRL, 2013; Durezt & Gerya, Tectonoph., 2013]
  3. Why are orogens curved when seen from space? [Weil & Sussman, 2004, GSASP 383]
  4. How does the long-term deformation derived from paleomagnetism and structural geology link quantitatively to the present-day motions derived from GPS and from neotectonic patterns of crustal deformation? [Calais et al., EPSL, 2003] How do these last two relate to each other? [ref] Can we learn from regional structure of the crust/lithosphere from that link (or viceversa)? 
  5. Are plate interiors moving in steady-state linear motion? How rigid are these and why/when did they deform? [Davis et al., (2005) doi:10.1038/nature04781, and Wernicke & Davis, (2010) doi:10.1785/gssrl.81.5.694]
  6. How is the relative motion between continents accommodated in diffuse plate boundaries? (eg., the Iberian/African plate boundary). What determines the (a)seismicity of a plate contact? 
  7. How/when does deformation propagate from the plate boundaries into plate interiors? [e.g., Cloetingh et al., 2005, QSR] 
  8. What is the rheological stratification of the lithosphere: like a jelly sandwich? Or rather like a creme brulée? [Burov & Watts, 2006]. Is the lower crust ductile? Is strength concentrated at the uppermost mantle? Or just the other way around? [e.g., McKenzie et al., 2000, JGR; Jackson, 2002, GSA TodayHandy & Brun, 2004; and a nice recent post]
  9. Add caption
      Does the climate-controlled erosion and surface transport of sediment modify the patterns of tectonic deformation? Does vigorous erosion cause localized deformation in the core of mountain belts and prevent the propagation of tectonic shortening into the undeformed forelands? Does the deposition of sediment on the flank of mountains stop the frontal advance of the orogen? Is there any field evidence for these effects predicted from computer models? [Philip Allen's blog] [Willett, 1999, JGRWhipple, 2009Garcia-Castellanos, EPSL, 2007]
    1. Can earthquakes be predicted? [Heki, 2011, GRLFreed, 2012, Nat.Geosc.]. How far away can they be mechanically triggered? [Tibi et al., 2003, Nature]. Little is known about how faults form and when do they reactivate [ex.6], and even worse, there seems to be no clear pathway as to solve this problem in the near future. Unexpected breakthroughs needed. 
    2. How can the prediction of volcanic eruptions be improved? What determines the rates of magma accumulation in the chamber and what mechanisms make magmas eruptible? [ex.7][ex.7b]
    3. In many regions, the elevation of the continents does not match the predictions from the classical principle of isostasy for the Earth's outer rigid layer (the lithosphere). This deviation is known as dynamic topography, by opposition to isostatic topography. But what are the mechanisms responsible? Can we learn about the mantle dynamics by estimating dynamic topography? [ref.1Can the hidden loads needed to explain the accumulation of sediment next to orogens (foreland basins) be linked to these dynamic forces? [Busby & Azor, 2012, Wiley]
    4. How do land-forming processes react to climate change at a variety of scales, ranging from the Milankovitch cycles to the late Cenozoic cooling of the Earth? Is there a feedback from erosion into climate at these time scales, through the Carbon cycle and the weathering of silicates, for example? What is the role of the surface uplift and erosion of Tibet on the drawdown of atmospheric CO2 over the Cenozoic? [Garzione, 2008, Geology]

    Earth's landscape history and present environment

    The shape of the planet's solid surface, its topography, is the key feature that connects many of the disciplines within Earth science, probably because it is the feature that most affects our daily life. It is today common wisdom that landscape forms from a complex interplay between tectonics and climate, through a list of mechanical, chemical, and biological processes acting at the surface of the Solid Earth. Topographic data is becoming now available at resolutions finer than a few meters, and the sedimentary record is also being archived at unprecedented rates. But:
    Drainage patterns in Yarlung Tsangpo River, China (NASA)

    1. Can we use these data to derive past tectonic and climatic conditions? Will we ever know enough about the erosion and transport processes? Was also the stocasticity of meteorological and tectonic events relevant in the resulting landscape? And how much has life contributed to shape the Earth's surface? 
    2. Can classical geomorphological concepts such as 'peneplanation' or 'retrogressive erosion' be understood quantitatively? Old mountain ranges such as the Appalachian or the Urals seem to retain relief for > 10^8 years, while fluvial valleys under the Antarctica are preserved under moving ice of kilometric thickness since the Neogene. What controls the time-scale of topographic decay? [Egholm, 2013, Nature]
    3. What are the erosion and transport laws governing the evolution of the Earth’s Surface?[Willenbring et al., Geology, 2013] Rivers transport sediment particles that are at the same time the tools for erosion but also the shield protecting the bedrock. How important is this double role of sediment for the evolution of landscapes? [Sklar & Dietrich, Geology, 2001 (tools and cover effect); Cowie et al., Geology, 2008 (a field example)].
    4. Can we predict sediment production and transport for hazard and scientific purposes? [NAS SP report, 2010Geology, 2013] 
    5. Smaller-scale patterns at the limit
      between river channels and hillslopes.
      Credit: Perron Group, MIT
    6. What do the preserved 4D patterns of sediment flow tell us from the past of the Earth? Is it possible to quantitatively link past climatic and tectonic records to the present landforms? Is it possible to separate the signals of both processes? [e.g., Armitage et al., 2011, Nature Geosc]. 
    7. Can we differentiate changes in the tectonic and climate regimes as recorded in sediment stratigraphy? Some think both signals are indeed distinguishable [Armitage et al., 2011, Nat.Geo.]. Others (Jerolmack & Paola, 2010, GRL], argue that the dynamics intrinsic to the sediment transport system can be 'noisy' enough to drown out any signal of an external forcing. 
    8. Does surface erosion draw hot rock towards the Earth’s surface? Do tectonic folds grow preferentially where rivers cut down through them, causing them to look like up-turned boats with a deep transverse incision? [Simpson, 2004, Geology]
    9. How resilient is the ocean to chemical perturbations? What caused the huge salt deposition in the Mediterranean known as the Messinian Salinity Crisis? Was the Mediterranean truly desiccated? What were the effects on climate and biology, and what can we learn from extreme salt giants like this? [e.g., Hsu, 1983Clauzon et al., Geology, 1996; Krijgsman et al, 1999, NatureGarcia-Castellanos & Villaseñor, Nature, 2011]. Were the normal marine conditions truly reestablished by the largest flood documented on Earth, 5.3 million years ago? [Garcia-Castellanos et al., 2009, Nature]
      Artistic view of the refilll of the
      Mediterranean after the Messinian salinity
      crisis. Authors: Pibernat & Garcia-Castellanos.
      Downloadable here.
    10. How do the patterns of river networks form? [eg. Devauchelle et al., 2012, PNAS; Perron et al., 2012, Nature]. And what information about the past do these patterns contain? Can we quantitatively reconstruct past ecology or climate from old river patterns? [e.g., Hartley et al., 2010, J. Sedim. Res.]
    11. Do we need a new geological epoch called Anthropocene? When do the Homo Sapiens start to have a significant impact on the Earth System? 8000 BP?[Ruddiman, 2003, Climatic Change]; 2000 BP? [Scalenghe, 2011, The Holocene]; 1850 AD? [Crutzen & Steffen, 2003]

    Climate, Life, and Earth

    Source: R.E..Rhode, Wikipedia
    The geological record shows that climate is relatively stable over tectonic time-scales whereas it undergoes abrupt changes in periods ranging from decades to hundreds of thousand years. Past periods when the planet underwent extreme climate conditions may help to understand the mechanisms behind that behavior and its significance for the evolution of the Solid Earth.

    1. What caused the largest carbon isotope changes in Earth? [Grotzinger et al., 2011, Nat. Geosc.] How does Earth’s climate system respond to elevated levels of atmospheric CO2? 
    2. Was there ever a snow-ball Earth during the earliest stages of Life on Earth? 
    3. Were there also rivers and lakes on Mars? [Hans, 2012] Were there large outburst floods similar to those on Earth
    4. What were the causes and what shaped the recovery from mass extinctions as those at the K-T boundary, the Permian-Triassic or the Late Triassic? Massive volcanism? Meteorites? Microbes? [recent papers: ex.8ex.9ex.10, Rothman et al., 2014, PNAS]
    5. What triggered the extreme climatic variability during the Quaternary and the roughly coeval acceleration in continental erosion and sediment delivery to the margins? [Peizhen, Molnar et al., 2001, Nature; Herman et al., 2013, NatureWas this related to the tectonic closure of the Central American Seaway? How do these climate events translate quantitatively into sea level changes?
    6. How do climate changes translate quantitatively into sea level changes? How do ice sheets and sea level respond to a warming climate? What controls regional patterns of precipitation, such as those associated with monsoons or El Niño?
    7. What caused the Quaternary extinction(s)? Human expansion? Climate Change? How sensitive are ecosystems and biodiversity to environmental change? Was the large fauna extinction ~13,000 yr ago a result of the Younger Dryas climatic event? Was this caused by an extraterrestrial impact? [ex.11ex.12] Or may it be linked to the outburst of Lake Agassiz
    8. How relevant are subsurface microorganisms to earth dynamics by controlling soil formation and the methane cycle? What are the origin, composition, and global significance of deep subseafloor communities? What are the limits of life in the subseafloor realm?  
    9. The atmosphere is shaped by the presence of life, a powerful chemical force. The Earth’s evolution has seems to affect the evolution of life [see the Cambrian explosion of animal life, for instance; plus this recent paper on that]. To what extent? And how much control has life on climate? [another recent one]. Is it possible to quantify these links to make reliable predictions that allow filling the data gaps or assessing the chances for extraterrestrial life?
    10. How much of the present climate change is anthropogenic? How will growing emissions from a growing global population with a growing consumption impact on climate? 

    Broader open questions


    1. Many of the questions above are related to the extreme diversity of spatial scales of Earth processes. Direct observation (by sampling or remotely) is mostly limited to a thin layer around the solid surface of the Earth, and physical experimentation is limited to the pressures of the uppermost layers of the planet. Many processes including plate tectonics are known to be driven by the nature of the materials that make up the planet interiors, down to the smallest atomic scales, as thought for instance for the trigger of earthquakes. Answers may arrive via new devices and analytical tools working at the high pressures and temperatures of Earth’s interior.
    2. Time scales also pose a problem to know the mechanical and chemical properties of Earth's materials. Partly because we deal with time scales in very different orders of magnitude while we are limited to make observations from the present. But also because scaling the rates of lab experiments (e.g., mineral physics) or analogue models (e.g., sandbox experiments) with the corresponding geological scenarios is not always convincing. 
    3. Implementing Episodicity in Gradualism: For historical reasons, geology has generally underestimated the role of episodicity in nature. However, there is a growing view that exceptional events and stochasticity have a relevant role in many of Earth's subsystems. An example for this is the preeminence of flooding events (larger than average) in erosion and surface sediment transport and during the evolution of landscape, and the importance of upscaling flood stochasticity into sediment transport models [eg., Lague, 2010, JGR]. Climate variability at all time-scales has been already mentioned above. Even plate tectonics may have been episodic (during the Archean at least, [ref]).  4D hyperscale data sets in geomorphology are increasingly showing the limits of smooth-process approaches. Future understanding of the Earth will benefit from incorporating the full frequency spectrum (the episodicity) in modeling natural phenomena, rather than systematically approaching these as gradual processes. 
    4. Computer models tell whether the complexity of nature can be explained by the interplay between simple processes, but: how can we further model the Earth as a complex system of complex systems? And when can we expect ‘compact’ explanations? 

    General background:
      Note that the specific references given above for each open question are sometimes just examples and may not always be the best representative. Furthermore, the list is surely biased towards Solid Earth Science, my own field. The following general references can give you an alternative perspective on the subject.
      Please send additions/suggestions to d.g.c@csic.es

      Acknowledgements:
      For various inputs/criticisms to this list: Brian Romans, Umberto Lombardo, Jean Braun, Mikael Attal, Alexandra Witze, Michael Klaas, Matt Hall, Chris Rowan.
      PD: I published a shorter version of this post in Mapping Ignorance. -Daniel

      2014-02-14

      How to refill the Mediterranean?

      Mapping Ignorance
      ResearchBlogging.org
      Let me tell a story about serendipity in research, a story that involves abrupt changes in the Earth's landscape and a 5-million-year-old flood of unprecedented scale.


      Classical authors such as Aristotle, Galileo, or Leonardo da Vinci, used to describe the birth of the Mediterranean Sea as an enormous flood through the Strait of Gibraltar that filled a desiccated basin. These stories trace back to the oldest known encyclopedia: Plinius' Historia Naturalis (1st century AD). In its 3rd volume, Plinius the Elder recounted a legend from southern Hispania that attributed the formation of the Strait of Gibraltar to Hercules, the god who "allowed the entrance of the ocean where it was before excluded". The Atlantic Ocean flooding a desertic Mediterranean Sea at epic scales. Amazingly enough, the geophysical and geological research carried out in the last decades seems to suggest that this ancient vision may be quite appropriate.

      Since the identification of vast salt strata throughout the Mediterranean by Austrian naturalist Karl Mayer (late nineteenth century) we know that the marine connections between this sea and the Atlantic Ocean became small by the end of the Miocene, during a period known as the Messinian age. Modern chronostratigraphy has dated this at 6 to 5.3 million years ago, around the time when our earliest hominin ancestors started walking on two legs in Central Africa. As a result, the Mediterranean became a huge salt pan that accumulated about 10% of the salt dissolved in the world's oceans, during the so-called Messinian salinity crisis. The ongoing tectonic uplift of the Gibraltar Arc region finally emerged the last Atlantic seaway and isolated completely the Mediterranean from the ocean, about 5.6 million years ago. The Mediterranean then became largely evaporated as a result of the dry climate of its watershed. Finally, about 5.3 million years ago the Mediterranean was refilled from the Atlantic through the Strait of Gibraltar. The indications that this occurred geologically very fast (namely, the abrupt change from Miocene to Pliocene sedimentary layers) made this event be known as the Zanclean flood.
      Simulation of the refill through the strait of Gibraltar
      by Steven N. Ward (Univ. California).
      Note the water velocity distribution around 1:27.

      Geological map of the Gibraltar strait locating the
      erosion channel (red) observed with geophysical
      methods.
      The flood along the Gibraltar threshold may have been caused by its subsidence below the Atlantic level, or by faulting, or by erosion (or a combination of these three proposed mechanisms). But beyond the causes for the flood, another key unknown is the abruptness and evolution of the flood itself: From the sharp transition in the sedimentary layer record, it is widely thought (though not unanimously) that the event was very fast. But in geology fast can mean a hundred thousand years. Because little was known about its dynamics, and perhaps because for geologists rapid major events are rare and challenge the principle of uniformitarianism, the flood duration underwent a wide range of estimations from tens to tens of thousands of years.

      Before knowing anything about the Messinian Mediterranean, I used to model the evolution of landscape over geological time scales, particularly interested on the role of lakes in controlling the long-term evolution of topography of large continental regions.

      Lakes are those water bodies collecting precipitation in local topographic minima (yes, this sounds a bit Sheldon-like). Lakes are usually ephemeral over geologic timescales: Unless there are vertical tectonic motions enlarging the topographic basin, they soon fill up with sediment, overspilling their banks. When the water finds a way out, it incises along the outlet, drawing the lake's level down, and propagating this erosion upstream into the lake. In our landscape evolution models this transition was systematically very fast, but this result was not convincing enough for two reasons: First, lake data to compare with were scarce, and we were in the need of a large case scenario where traces of erosion were more evident. Secondly, our models where not accounting for transitory water flow, but instead it was calculating a steady flow (i.e., the water precipitation equals the water losses through evaporation at each time step of the simulation).

      2D simulation of the evolution of a tectonic lake 
      formed in front of a growing tectonic barrier. 
      The lake evaporates the water collected from 
      the left side. When the barrier stops growing, 
      its erosion leads to a sudden capture of the lake.

      Then I accidentally learned about the Messinian salinity crisis, about its impact in the Mediterranean evolution, and about the megaflood hypothesis for its ending. It struck me that the feedback between water flow and incision we envisaged for lakes should be similar during the Zanclean flood, taking the global ocean as a huge lake on the verge of overtopping towards the dry Mediterranean. Combining the formulation of river incision with the proper hydrodynamic equations, we built a simple but robust mathematical formulation for overtopping outburst floods. We used then erosional parameters derived from the study or mountain river incision, and then incorporated a reconstruction for the Mediterranean seafloor geometry. Then we started running virtual floods. 

      The first results were so surprising that we thought something was probably wrong with the code. Things were happening much faster than in those lake scenarios we were used to. Because in the Zanclean flood the source is virtually infinite, the Mediterranean was filling in only a few years along a large erosion channel excavated across the Strait of Gibraltar, some hundred meters deep. Unfortunately, the results were strongly dependent on a parameter that is badly constrained: the erodibility of rocks. But if that was correct, we should be able to find traces of the flood erosion preserved under the sedimentary layers in the strait. 

      Dry Mediterranean, by Roger Pibernat.
      So we turned towards previously published research, finding two other pieces of evidence: The first was a vintage seismic image showing a cross-section of the sedimentary layers near the strait area (Campillo et al., 1992). It showed a clear channel running west to east from the strait into the Alborán Sea, carved in the pre-Messinian sediments. The channel had previously been thought to be the result of river erosion of the dried-up strait, but there’s no obvious large river that could have produced that erosion. The second piece of evidence came from cores of rock drilled from the strait area as part of the exploration for the Africa-Europe tunnel project that would build a train connection between Spain and Morocco (Blanc, 2002). These cores also showed a channel deeper than 200 m, wider than 3 km, and filled with post-Messinian sediment. Altogether, the documented erosion valley connecting the Eastern Atlantic to the Western Mediterranean is more than 200-kilometre long. If this were a result of fluvial erosion, it would be strange to find erosion on both sides of the present water divide between Atlantic and Mediterranean. Furthermore, rather than a waterfall over the Gibraltar Strait as previously suggested, the seismic data show a huge ramp, several kilometres wide descending rather gradually from the Atlantic to the Mediterranean.

      With these data, we turned again to the models. Using the observed erosion depth and width as a constrain, the model estimated now that the flood may have began slowly, taking up to several thousand years before a significant rise in Mediterranean level occurred. But importantly they also show that 90% of the water must have entered in a period shorter than two years, and that at the peak discharge, water poured in at a rate of 100 million cubic meters per second, about a thousand times the largest river on Earth today. If 'harder' erosion parameters were used, then the refill of the Mediterranean would be predicted to be slower, but the calculated erosion at the end of the flood would be insufficient to reproduce the geophysical images. To fit the observations, the flooding channel had to cut down into the bedrock almost half a meter per day, leading to a large inlet flow that would increase the Mediterranean sea level by more than 10 meters per day.

      The technique does not allow constraining the speed of the initial stages, nor the mechanisms involved in triggering the flood. This means that the initial trigger may have been a geologically modest event such a large storm, a tsunami, or a partial collapse of the dividing barrier. What the results do ensure is that in order to account for the final size of the erosion channel, 90% of the water must have been rapidly transferred in a period ranging from a few months to two years.

      Possible evolution of the flood derived from the model. The lower panel shows the evolution of the seaway depth as it is eroded by the increasing flow of water (black lines, left scale) and the rising Mediterranean level (red lines). From our article in Nature. 

      If these observations and calculations are independently confirmed, the Zanclean flood would become the largest known flood on Earth's history. The Zanclean flood involved an order of magnitude more water flow than the megafloods that we know took place during the last deglaciation (e.g., the Missoula floods or the Bonneville flood). 

      The implications of such a rapid flooding are inevitably big, as a large number of multidisciplinary studies have documented: Global flora and fauna had to adapt to the new environmental conditions rapidly. Marine species colonized a huge new realm rapidly whereas for land species, particularly in islands, the flooded Mediterranean became a sudden barrier triggering speciation. Had the land connection remained, it could have facilitated an earlier arrival of early humans in western Europe. Instead early humans had to take a circuitous route to Western Europe and didn't arrive until 1.5 million years ago. The Messinian salinity crisis also highlights the importance of seaways in understanding the geological record: straits limit the mix with the global ocean and their size is the key parameter modulating the chemical registry found in sediment. The flood may also have had tectonic implications: The weight of the flooding waters is such that it should have modified the rotation of the Earth, and it should have made the entire Mediterranean region sink by at least one kilometer in the mantle, according to the principle of Isostasy. Also global climate surely must have been impacted by the Messinian salinity crisis and its rapid ending, but so far this is perhaps the most elusive aspect of the crisis, something remarkable since I am not aware of other scenarios in geological history where the climatic response to such a large environmental change can be better tested.

      So there are plenty of open questions on the Zanclean Flood that need an answer. More pending Retos Terrícolas.

      Video on the Atlantropa Project, showing the collapse of a 
      projected dam across the Strait of Gibraltar.

      [This is related to research of our own group here at CSIC, as published in this article]
      [This post has been published in Mapping Ignorance]

      References:
      • Blanc, P.-L. The opening of the Plio-Quaternary Gibraltar Strait: assessing the size of a cataclysm, Geodin. Acta 15, 303—317 (2002).
      • Campillo, A., Maldonado, A. & Mauffret, A., Stratigraphic and tectonic evolution of the western Alboran sea: Late Miocene to recent, Geo Mar. Lett., 12, 165– 172 (1992).
      • Garcia-Castellanos, D., 2006. Long-term evolution of tectonic lakes: Climatic controls on the development of internally drained basins. In: Tectonics, Climate, and Landscape evolution. Eds.: S.D. Willett, N. Hovius, M.T. Brandon & D.M. Fisher. GSA Special Paper 398. 283-294. doi:10.1130/2006.2398(17) [pdf]
      • Garcia-Castellanos, D., F. Estrada, I. Jiménez-Munt, C. Gorini, M. Fernàndez, J. Vergés, R. De Vicente, 2009. Catastrophic flood of the Mediterranean after the Messinian salinity crisis. Nature 462, 778-781 doi:10.1038/nature08555 [pdf]